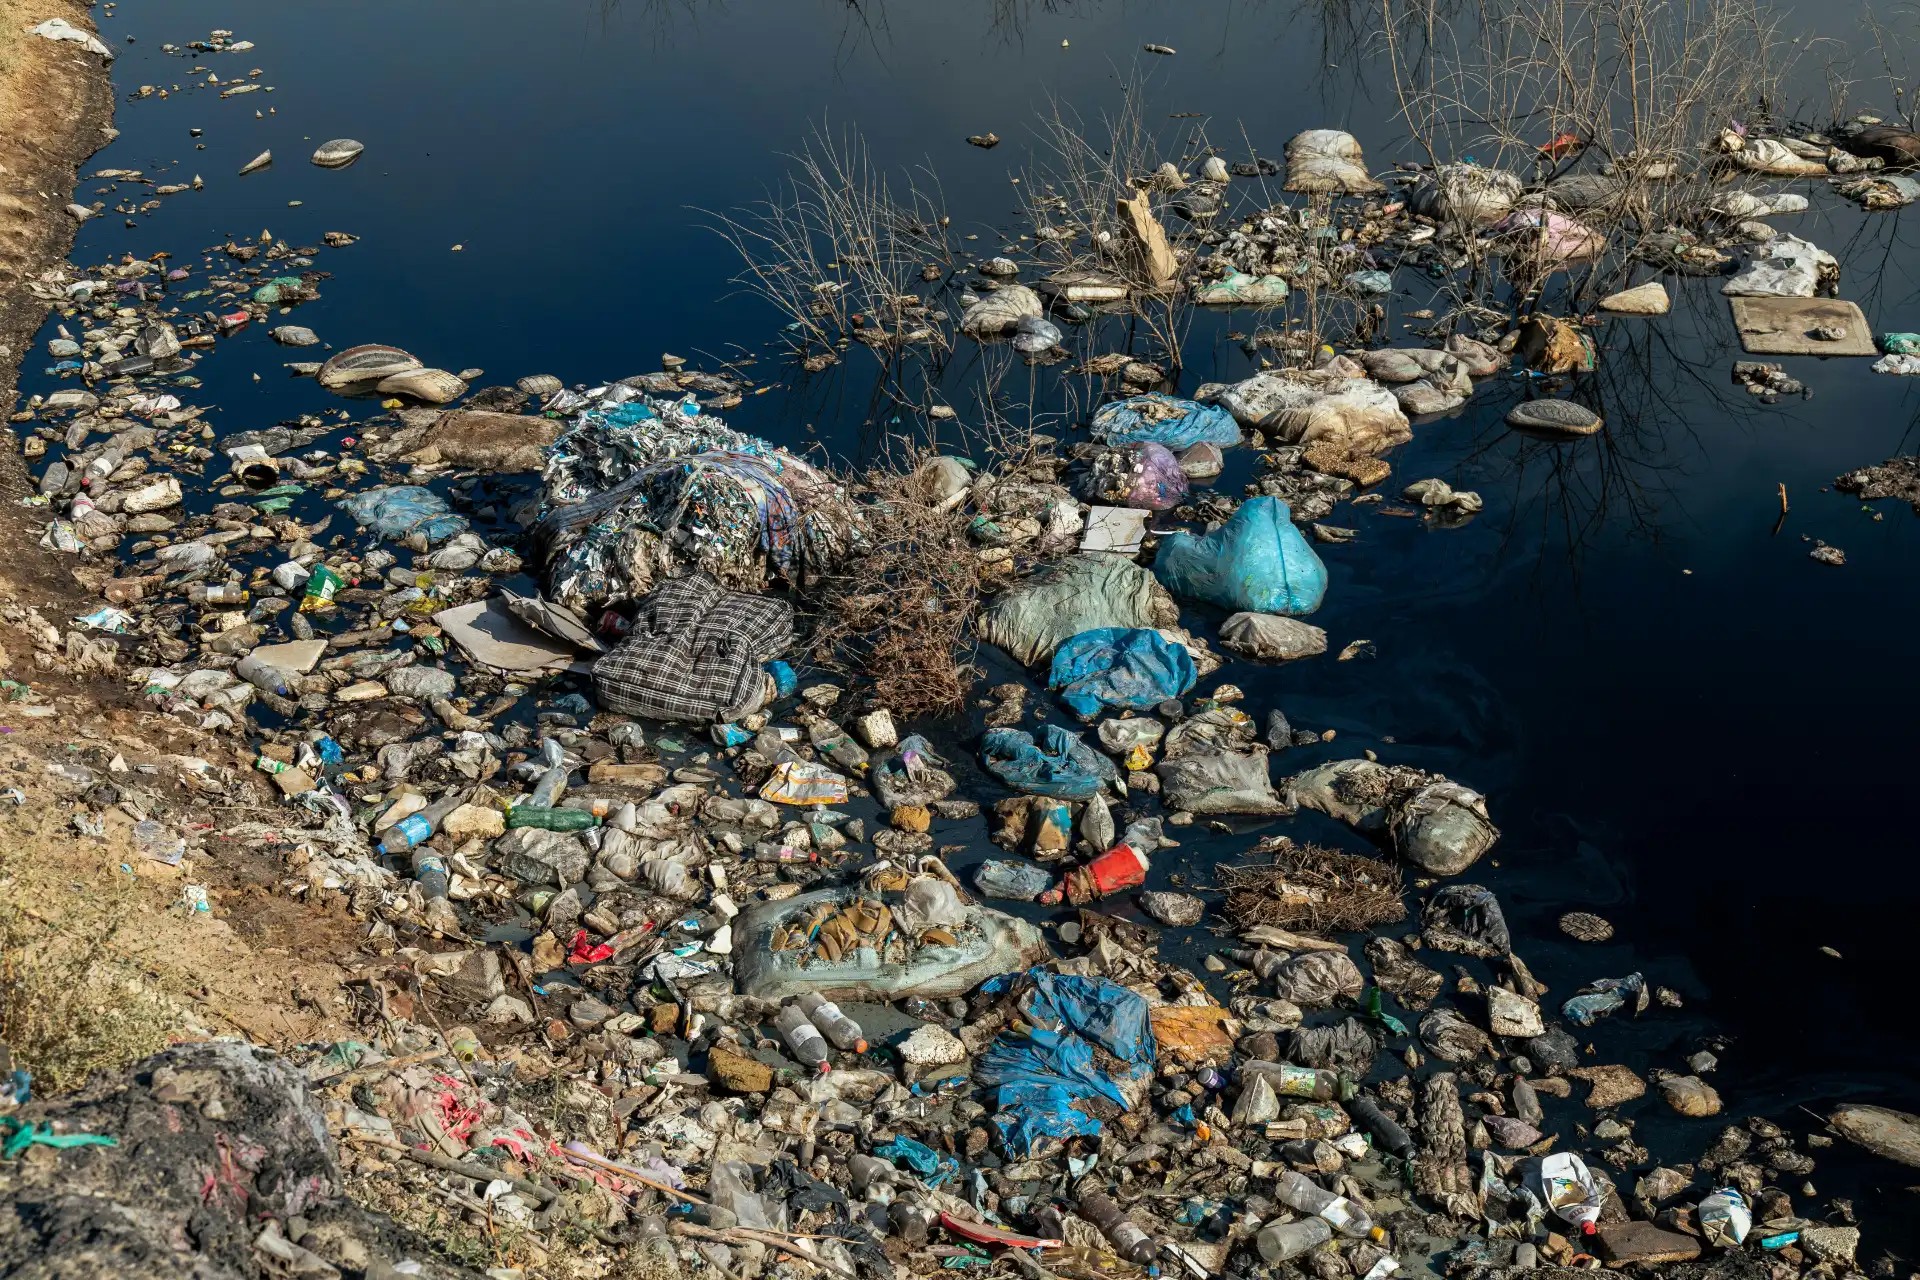
Nano- and Microplastics – How Much Is Around Us?
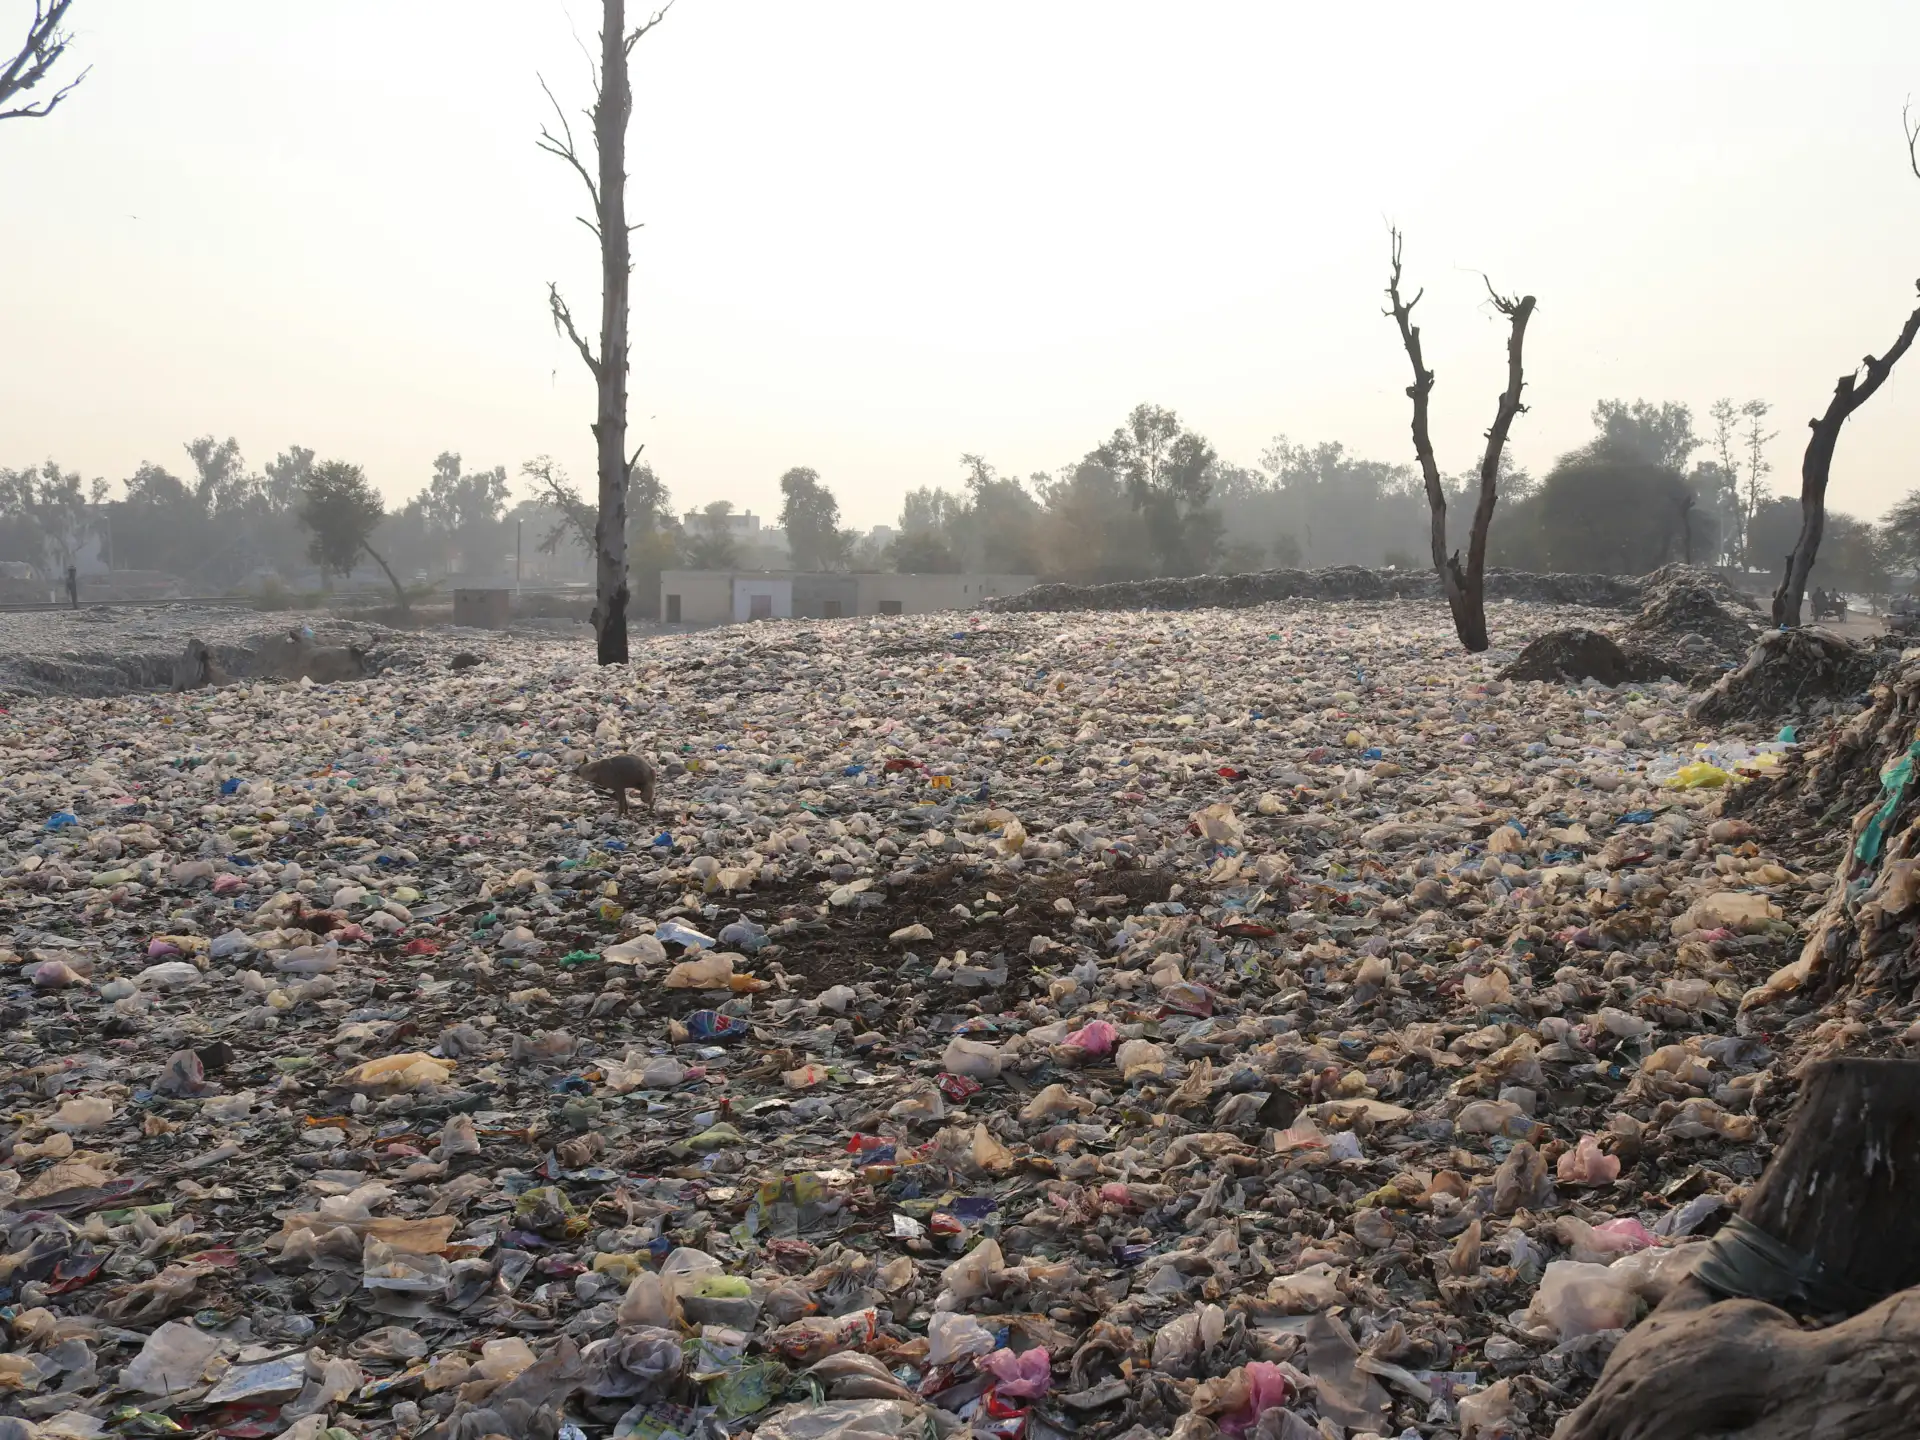
In our previous article we defined micro- and nanoplastics, examined the economic logic of plastic production and wrote about their effects on the human body. If you have not yet read the first article in the series, we recommend doing so, as it provides context for this one.
This time we look at how these particles get into our bodies, how much pollution there actually is around us – and what we can do about it.
How do microplastics get into our bodies? Routes of intake ranked
Micro- and nanoplastics can enter the human body by four main routes: inhalation, food, drinking water and, to a lesser extent, skin contact. They are not equally important.
Inhalation comes first, which surprises many people. According to an analysis of 130 scientific studies by Tang (2025), indoor air contains eight times more microplastics than outdoor air.
City dwellers are estimated to inhale 39,000–52,000 microplastic particles a year (Hoang et al., 2025).
Inhalation
Particles smaller than 10 micrometres penetrate deep into the lungs – the nanoscale fraction can even enter the bloodstream and reach the whole body. Indoor air pollution is generated by the constant wear of synthetic textiles, carpets, furniture and plastic coverings. A comprehensive 2025 analysis confirmed that the submicron fraction can cross the alveolar barrier and enter the systemic circulation (Zhang et al., 2025) – which makes inhalation the most worrying exposure route.
Food
Food comes second. Intake is possible at every level of the food chain – from marine organisms to plastic packaging. Opening packaging, heating and washing up all promote the release of particles. One particularly striking figure: a single plastic tea bag steeped in hot water releases 11.6 billion micro- and 3.1 billion nanoplastic particles into a cup. Ultra-processed foods show significantly higher contamination than minimally processed ones – every step of the manufacturing process means another contact with plastic equipment and packaging surfaces.
Drinking water
Drinking water comes third – a smaller share than many people think, but not negligible. Tap water typically contains 0–61 particles per litre of microplastics, while water from PET bottles contained an average of 240,000 particles per litre in a 2024 study – 90% of them nanoscale (National Institutes of Health, 2024). It is important to stress that exposure through drinking water is much smaller than through inhalation and food, but the source and the way it is treated decisively influence the actual load.
Skin contact
Skin contact comes fourth, with a much smaller risk. Healthy, intact skin forms an effective physical barrier against particles larger than 1 micrometre. Damaged or inflamed skin makes penetration more likely, but it ranks last among priorities for individual action.
Microplastics in every corner of the world
In the air
In the air, values average 0.1–1.2 particles/m³ indoors and 0.01–0.4 particles/m³ outdoors. In cities, pollution from tyre wear and industrial activity leads to higher concentrations – the load is lower in the countryside, but far from zero. A 2025 study documented a remarkable phenomenon: microplastics from the atmosphere first settle on forest canopies – what researchers call the "comb effect" – and then reach the soil with rain or falling leaves (Weber & Bigalke, 2025).
Forest soil thus becomes a kind of slow reservoir that continuously collects atmospheric pollution. This means that even near-natural areas are not free of contamination.
In soil
Globally, microplastic concentrations in soil are estimated to be 4–23 times higher than in the oceans. Fragmenting agricultural films, compost made from sewage sludge and atmospheric deposition all add to the load. Rashid et al. (2025) point out that microplastics also move within the soil – earthworms and infiltrating rainwater transport them vertically, while they also affect soil structure and microbial activity.
A 2026 review of rural microplastics stresses that rural lakes, rivers and groundwater systems are also active receivers and potential sources of re-dispersal – so locally produced food does not automatically mean exemption from contamination (Bhowmik & Saha, 2026).
In water
Particles are present in high concentrations in water too. A study by the Budapest University of Technology and Economics (Jahanpeyma et al., 2026) offers a telling example from a major European river: measurements on the Danube in Budapest, right next to the city's wastewater treatment plant.
The average microplastic concentration was 65 particles/m³ in 2022, rising to 218 particles/m³ in 2023 in connection with a flood.
The lesson of the flood is particularly important: high water not only carries away particles already in the river but also mobilises pollution that had settled along the banks, temporarily multiplying the load. The dominant polymers were polystyrene (38%), polyethylene (18%) and polypropylene (11%) – the raw materials of everyday packaging.
Occupational exposure: this is where pollution takes on dramatic proportions. Airborne concentrations measured in textile factories can reach a million times household levels.
A study published in 2026 measured 620,000–1,200,000 particles/m³ in the work area of a microfibre manufacturer.
The particles were mostly submicron in size – exactly those that penetrate deepest into the lungs. According to Tanjil et al. (2025), textile workers' estimated annual microplastic intake through inhalation is 8.7 mg per kg of body weight per year. CDC/NIOSH guidance notes that several occupational health studies have documented an increased risk of respiratory disease – airway irritation, reduced lung capacity, increased coughing – among these workers (NIOSH, 2020). A 2023 study of plastics factory workers also showed that wearing face masks significantly reduced the measured load – so personal protective equipment is effective in this context.
What we eat and drink: microplastics in products
When it comes to bottled water, the intuitive assumption – that it is healthier than tap water – does not stand up to the data. According to a Columbia University study cited by the NIH, a litre of water from a PET bottle contains an average of 240,000 micro- and nanoplastic particles, 90% of them nanoscale (National Institutes of Health, 2024). In reusable PET bottles the figure averages 4,889 particles per litre – every opening, closing and wash releases more particles. Tap water contains far fewer: 0–61 particles per litre.
A person who drinks only bottled water takes in roughly 90,000 more microplastic particles a year.
A surprising twist is the question of glass bottles. A study published by ANSES in 2025 found that soft drinks, lemonades and beers in glass bottles contained an average of 100 microplastic particles per litre. The source is not the glass itself but the paint on the caps: tiny scratches that occur during storage release paint particles into the drink. No such link was observed for wine – the reason is not yet fully clear.
The microplastic content of food is detailed in the analysis by Jin et al. (2021). Sea salt contained 0.007–13.629 particles per gram – the extreme range reflects how polluted the source sea is. Shellfish contained 0–10.5 particles per gram and fish 0.06–8 particles per gram. Ultra-processed foods show significantly higher contamination than minimally processed ones – every step of the manufacturing process means another contact with plastic surfaces.
Food packed in plastic or film is also a direct source of microplastics. Zimmermann et al. (2025) showed that 96% of the food contact materials studied released measurable amounts of microplastics into the packaged product – even during normal, everyday use. Peeling off film or opening a tray breaks tiny particles off the polymer surface. Meat products packed on polystyrene trays contained 4.0–18.7 particles per kilogram, and the chemical composition of the particles matched the tray material exactly. The longer food is in contact with packaging and the higher the storage temperature, the more particles end up in the food.
Heating further increases the release of particles. When a hot drink is poured into a disposable paper cup, about 25,000 particles leach from the cup into the drink. All this highlights a more general point: the source of microplastic contamination is not always the component we think of first. Caps, closure mechanisms, trays, filter materials and the manufacturing process itself all contribute – often regardless of the obvious material of the container.
We have compiled an illustrative table showing the contamination of various foods and drinks documented by studies:
Micro- and nanoplastics in food
| Food | Concentration | Particle size |
|---|---|---|
| Staples | ||
| Salt (sea, lake, rock salt) | 0.007–0.681 particles/g (Indonesian sea salt: 13.629 particles/g) | 45–4,300 µm |
| Honey | 0.019–0.322 particles/g | 10–5,000 µm |
| Sugar | 0.119–0.379 particles/g | – |
| Fruit and vegetables | ||
| Apple | 52,600–307,750 particles/g | 1.56–3.19 µm |
| Pear | 98,325–302,250 particles/g | 1.87–2.59 µm |
| Broccoli | 65,025–201,750 particles/g | 1.86–2.95 µm |
| Lettuce | 26,375–75,425 particles/g | 2.18–2.78 µm |
| Carrot | 72,175–130,500 particles/g | 1.36–2 µm |
| Seafood and aquatic food | ||
| Shellfish (mussels, oysters, cockles) | 0–10.5 particles/g | 5–5,000 µm |
| Fish | 0.06–8 particles/g | 5–5,000 µm |
| Meat (excluding fish) | ||
| Chicken | 0.1–0.31 particles/g | 3–4,000 µm |
| Beef | 0.12–0.14 particles/g | 3–4,000 µm |
| Pork | 0.2 particles/g on average | 3–4,000 µm |
| Packaged food | ||
| Packaged meat (on XPS trays) | 4.0–18.7 particles/kg | 300–450 µm |
| Plastic tea bag | 11.6 billion particles/bag | 8.6–52.3 µm |
| Drinking water and beverages | ||
| Drinking water | 0–61 particles/l | 100–5,000 µm |
| Bottled water | 335.4 particles/l on average | from 6.5 µm |
| Beer | 0–14.3 particles/l | 100–5,000 µm |
| Iced tea | 1–6 particles/l | 100–2,000 µm |
| Soft drinks | 0–7 particles/l | 100–3,000 µm |
| Energy drinks | 0–6 particles/l | 100–3,000 µm |
| Milk | 4.2–8.8 particles/l | 11–5,000 µm |
Sources: Jin et al. (2021); Olmo and Holman (2025); Süssman et al. (2025)
The methods of the various studies offer interesting lessons in themselves. The extremely high contamination of fruit and vegetables compared with other foods is probably because the researchers were able to measure and identify even extremely small particles.
Re-examining the other foods in the table – focusing specifically on nanoplastics below 4 micrometres – would very likely raise the currently known values considerably.
The case of fruit and vegetables, and the fact that 90% of the average 240,000 particles measured in PET-bottled water are nanoscale, raise two questions:
- How extensive is the nanoplastic contamination that science is only now beginning to map?
- How much contamination can current analytical methods not yet measure reliably – especially in the submicron size range and in the dissolved polymer fraction?
What can we do as individuals to reduce exposure?
Eliminating microplastic exposure completely is not possible. The particles are already everywhere. But that does not mean we are helpless – the steps below are ranked by effectiveness.
A drinking water filter, and giving up bottled water. This is the measure that achieves the greatest reduction in exposure. Filters certified to NSF/ANSI 401 remove microplastics with an efficiency of 85% or more. Reverse osmosis systems also perform reliably for nanoscale particles.
Boiling tap water. According to Yu et al. (2024), boiling tap water and pouring it through a simple steel tea strainer removes nano- and microplastics with up to 90% efficiency – especially in hard water, where the limescale formed during boiling traps the particles. The method costs next to nothing and anyone can use it straight away.
Switching to glass, ceramic or stainless steel containers. Replacing plastic bottles and food containers is particularly important for hot liquids and food, and when containers go in the dishwasher – heat increases leaching in both cases. The same applies to storage: beeswax wraps or glass containers with lids are recommended instead of cling film.
Avoid heating plastic. Transferring food or drink to a ceramic or glass container before heating is a simple but effective step. A "microwave safe" label does not mean particles are not released – only that the container will not deform.
Less processed, less packaged food. Loose, unpackaged fruit and vegetables and products in large packs carry a lower microplastic load – one package covers several servings, and the food is in contact with less polymer surface. For tea, loose-leaf tea with a steel strainer is recommended; for coffee, a glass or ceramic French press.
Better indoor air: HEPA filters and ventilation. Since indoor air is one of the most significant sources of microplastics, air purifiers with HyperHEPA technology and regular, thorough vacuuming bring a noticeable reduction. Microplastics in dust settled on floors and furniture can enter the body through inhalation and hand-to-mouth contact – so regular cleaning is not just a matter of looks.
Synthetic textiles and washing. Using microfibre-catching laundry bags and preferring clothes made of natural materials – cotton, wool, linen – reduces both personal exposure and the environmental load. Synthetic fabrics release microfibres into wastewater with every wash, and some of them pass through wastewater treatment plants.
These individual steps help a lot – but they do not replace system-level change. The root of the microplastic problem lies in the economic logic described in the previous article. Individual choices serve to reduce our own exposure until the right decisions are taken to tackle the cause of the problem.
To be continued
This was the second part of our series. In the next part we turn to wastewater: how much micro- and nanoplastic passes through treatment plants, how much accumulates in sewage sludge, and what that means for the environment.
Microplastics are not only in the sea – they are in the air, soil, rivers, drinking water and food. Inhalation is the most common route of exposure, which makes it significant that indoor air is eight times more polluted than outdoor air. A litre of water from a PET bottle contains an average of 240,000 microplastic particles – filtered tap water carries a much lower load. Cold cuts packed on plastic trays, plastic tea bags and ultra-processed foods are also direct sources of intake. Concentrations measured in textile factories can reach a million times household levels. On an individual level, a water filter, glass and metal bottles and avoiding heating food in plastic are the most effective steps.
Microplastics are not an abstract environmental issue – they are in the air we breathe, the water we drink and the food we eat. This article looks at the scale of pollution in four dimensions: from ranking the routes of intake through environmental concentrations and product data to what individuals can do.
Of the four routes of intake, inhalation comes first: indoor air contains eight times more microplastics than outdoor air. City dwellers inhale 39,000–52,000 particles a year. In textile factories the figure can reach a million times household concentrations. Food comes second, followed by drinking water – skin contact poses the smallest risk.
Rivers show how pollution moves through the environment: a 2026 study on the Danube in Budapest, near the city's wastewater treatment plant, found microplastic concentrations rising to 218 particles per cubic metre during a flood in 2023.
Product data are surprising: a litre of water from a PET bottle contains an average of 240,000 particles, 90% of which are nanoplastics. Soft drinks in glass bottles are no exception, showing high contamination – because of the paint on the caps. Food packed in plastic or film is also a direct source: 96% of the food contact materials studied released measurable amounts of particles.
On an individual level, the most effective steps are installing an NSF/ANSI 401 certified water filter, boiling tap water, using glass or metal bottles, avoiding PET-bottled products and not heating food or drink in plastic.

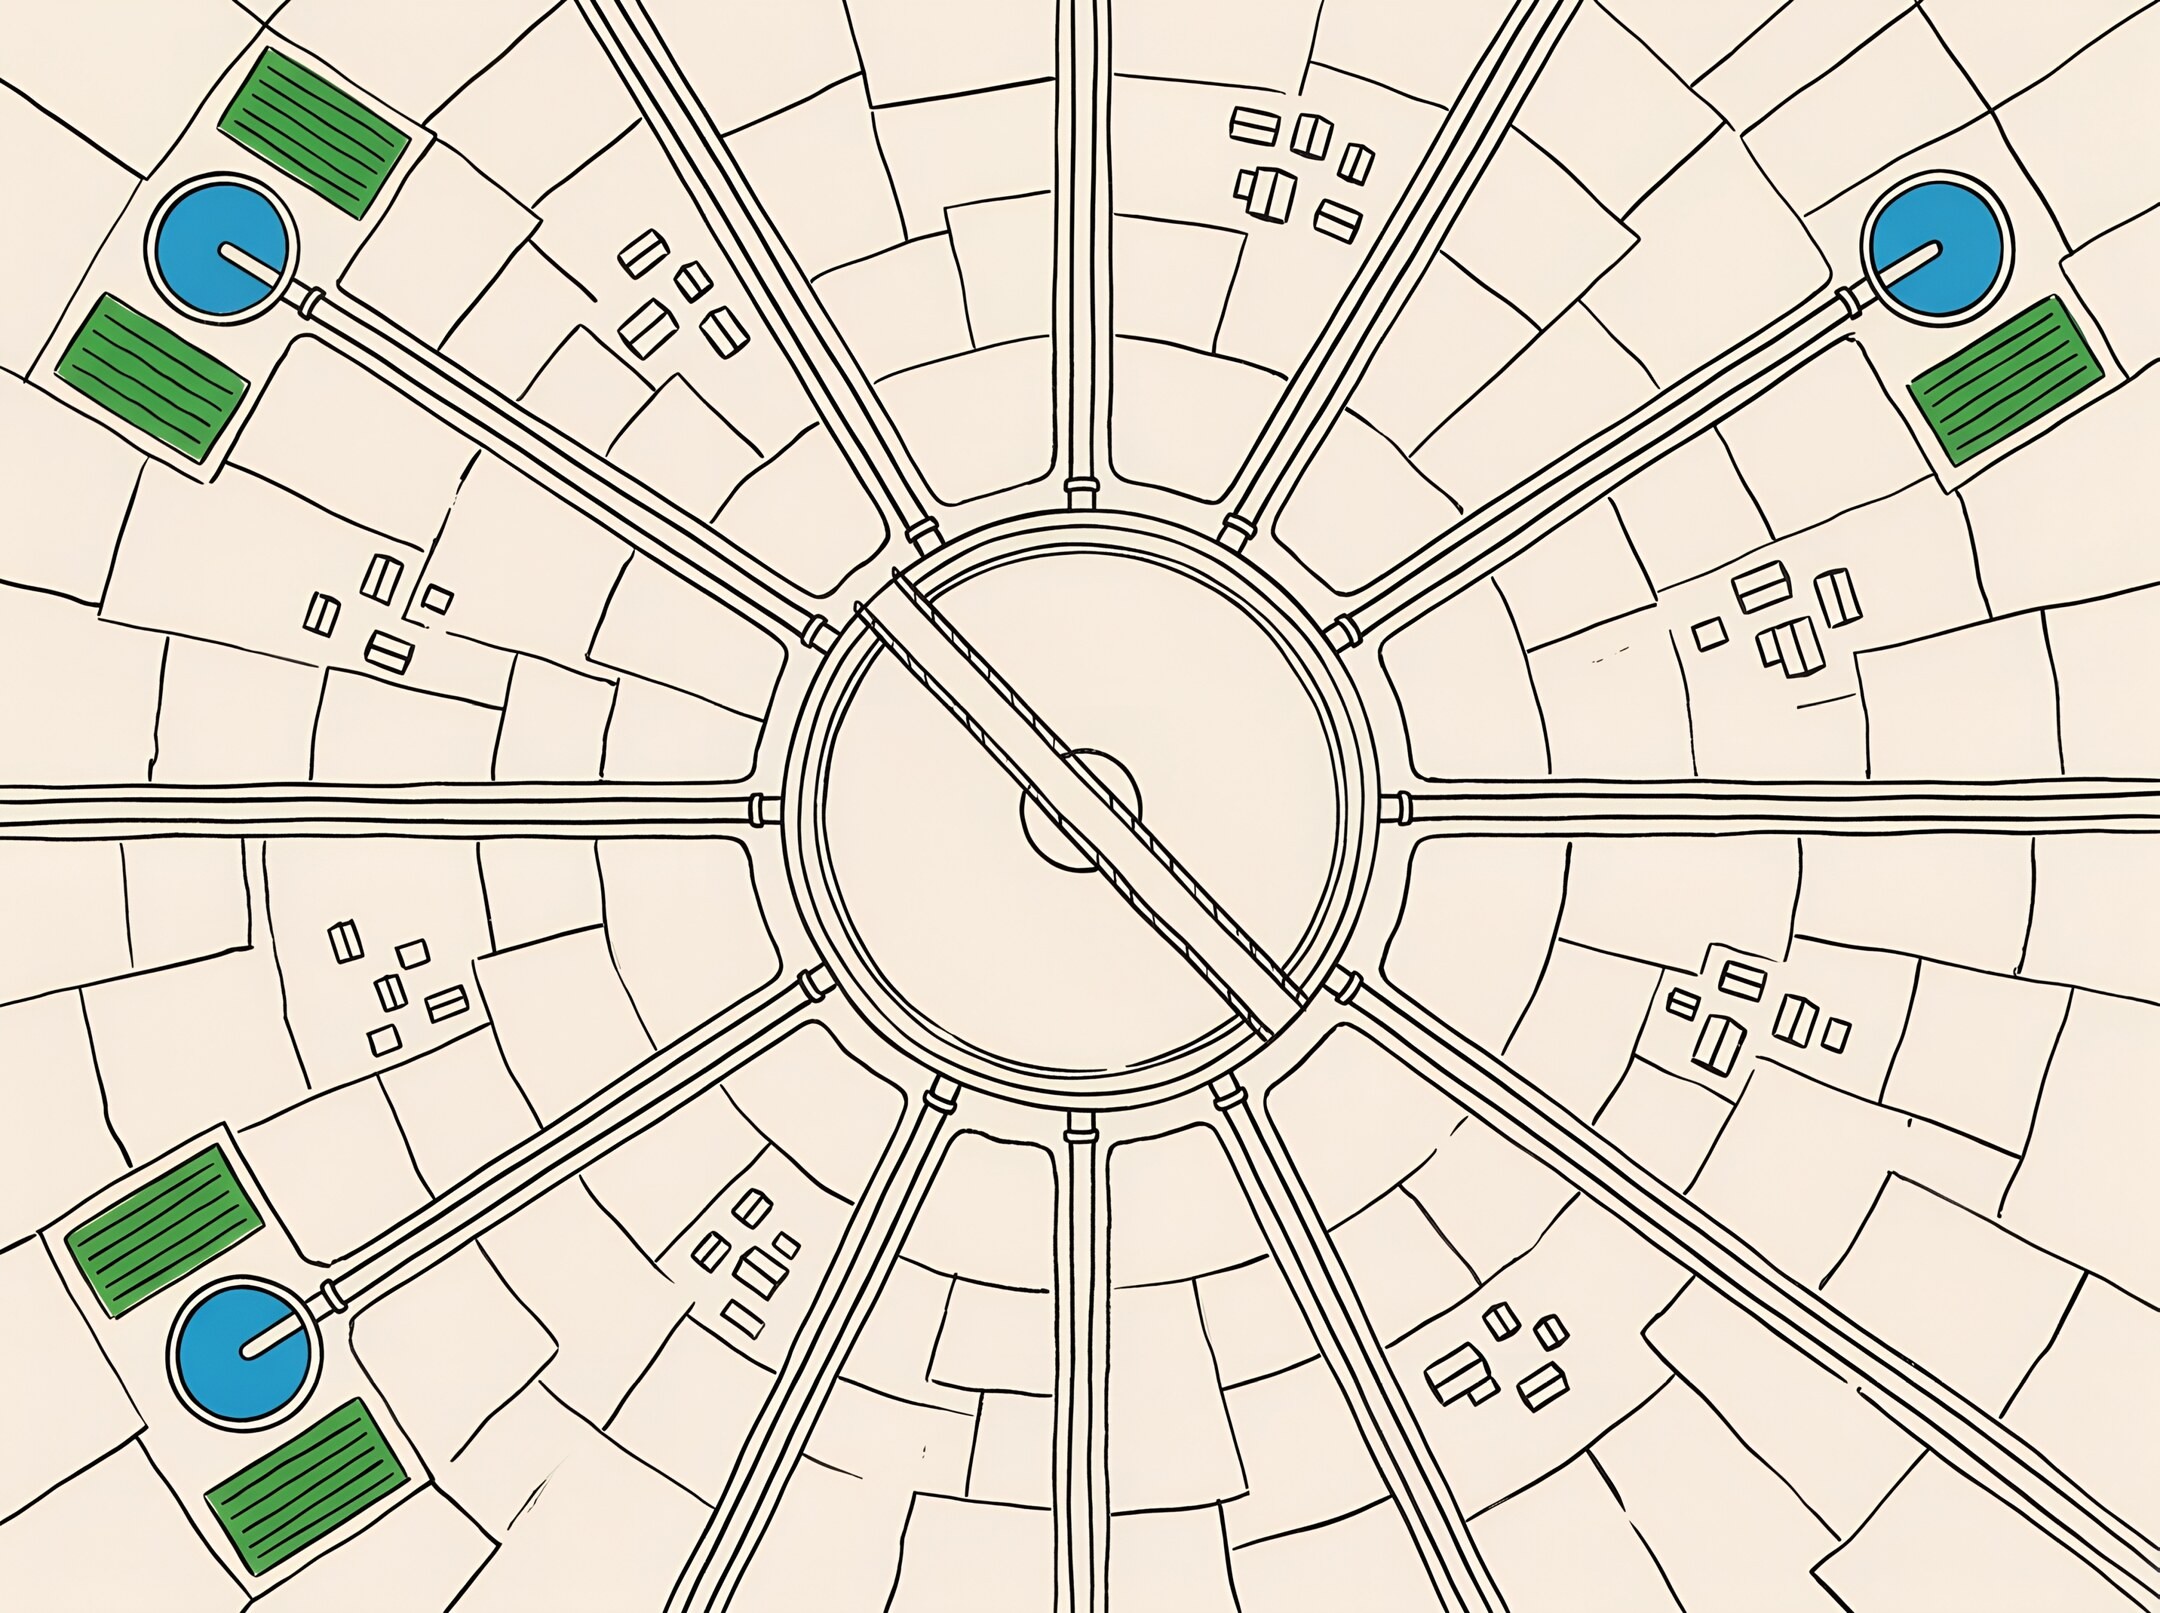

A study of 10,826 Chinese treatment plants finds that big centralised systems are reaching two limits at once, on easing water scarcity and on paying their way, and that a hybrid model could do the job for up to 37% less.
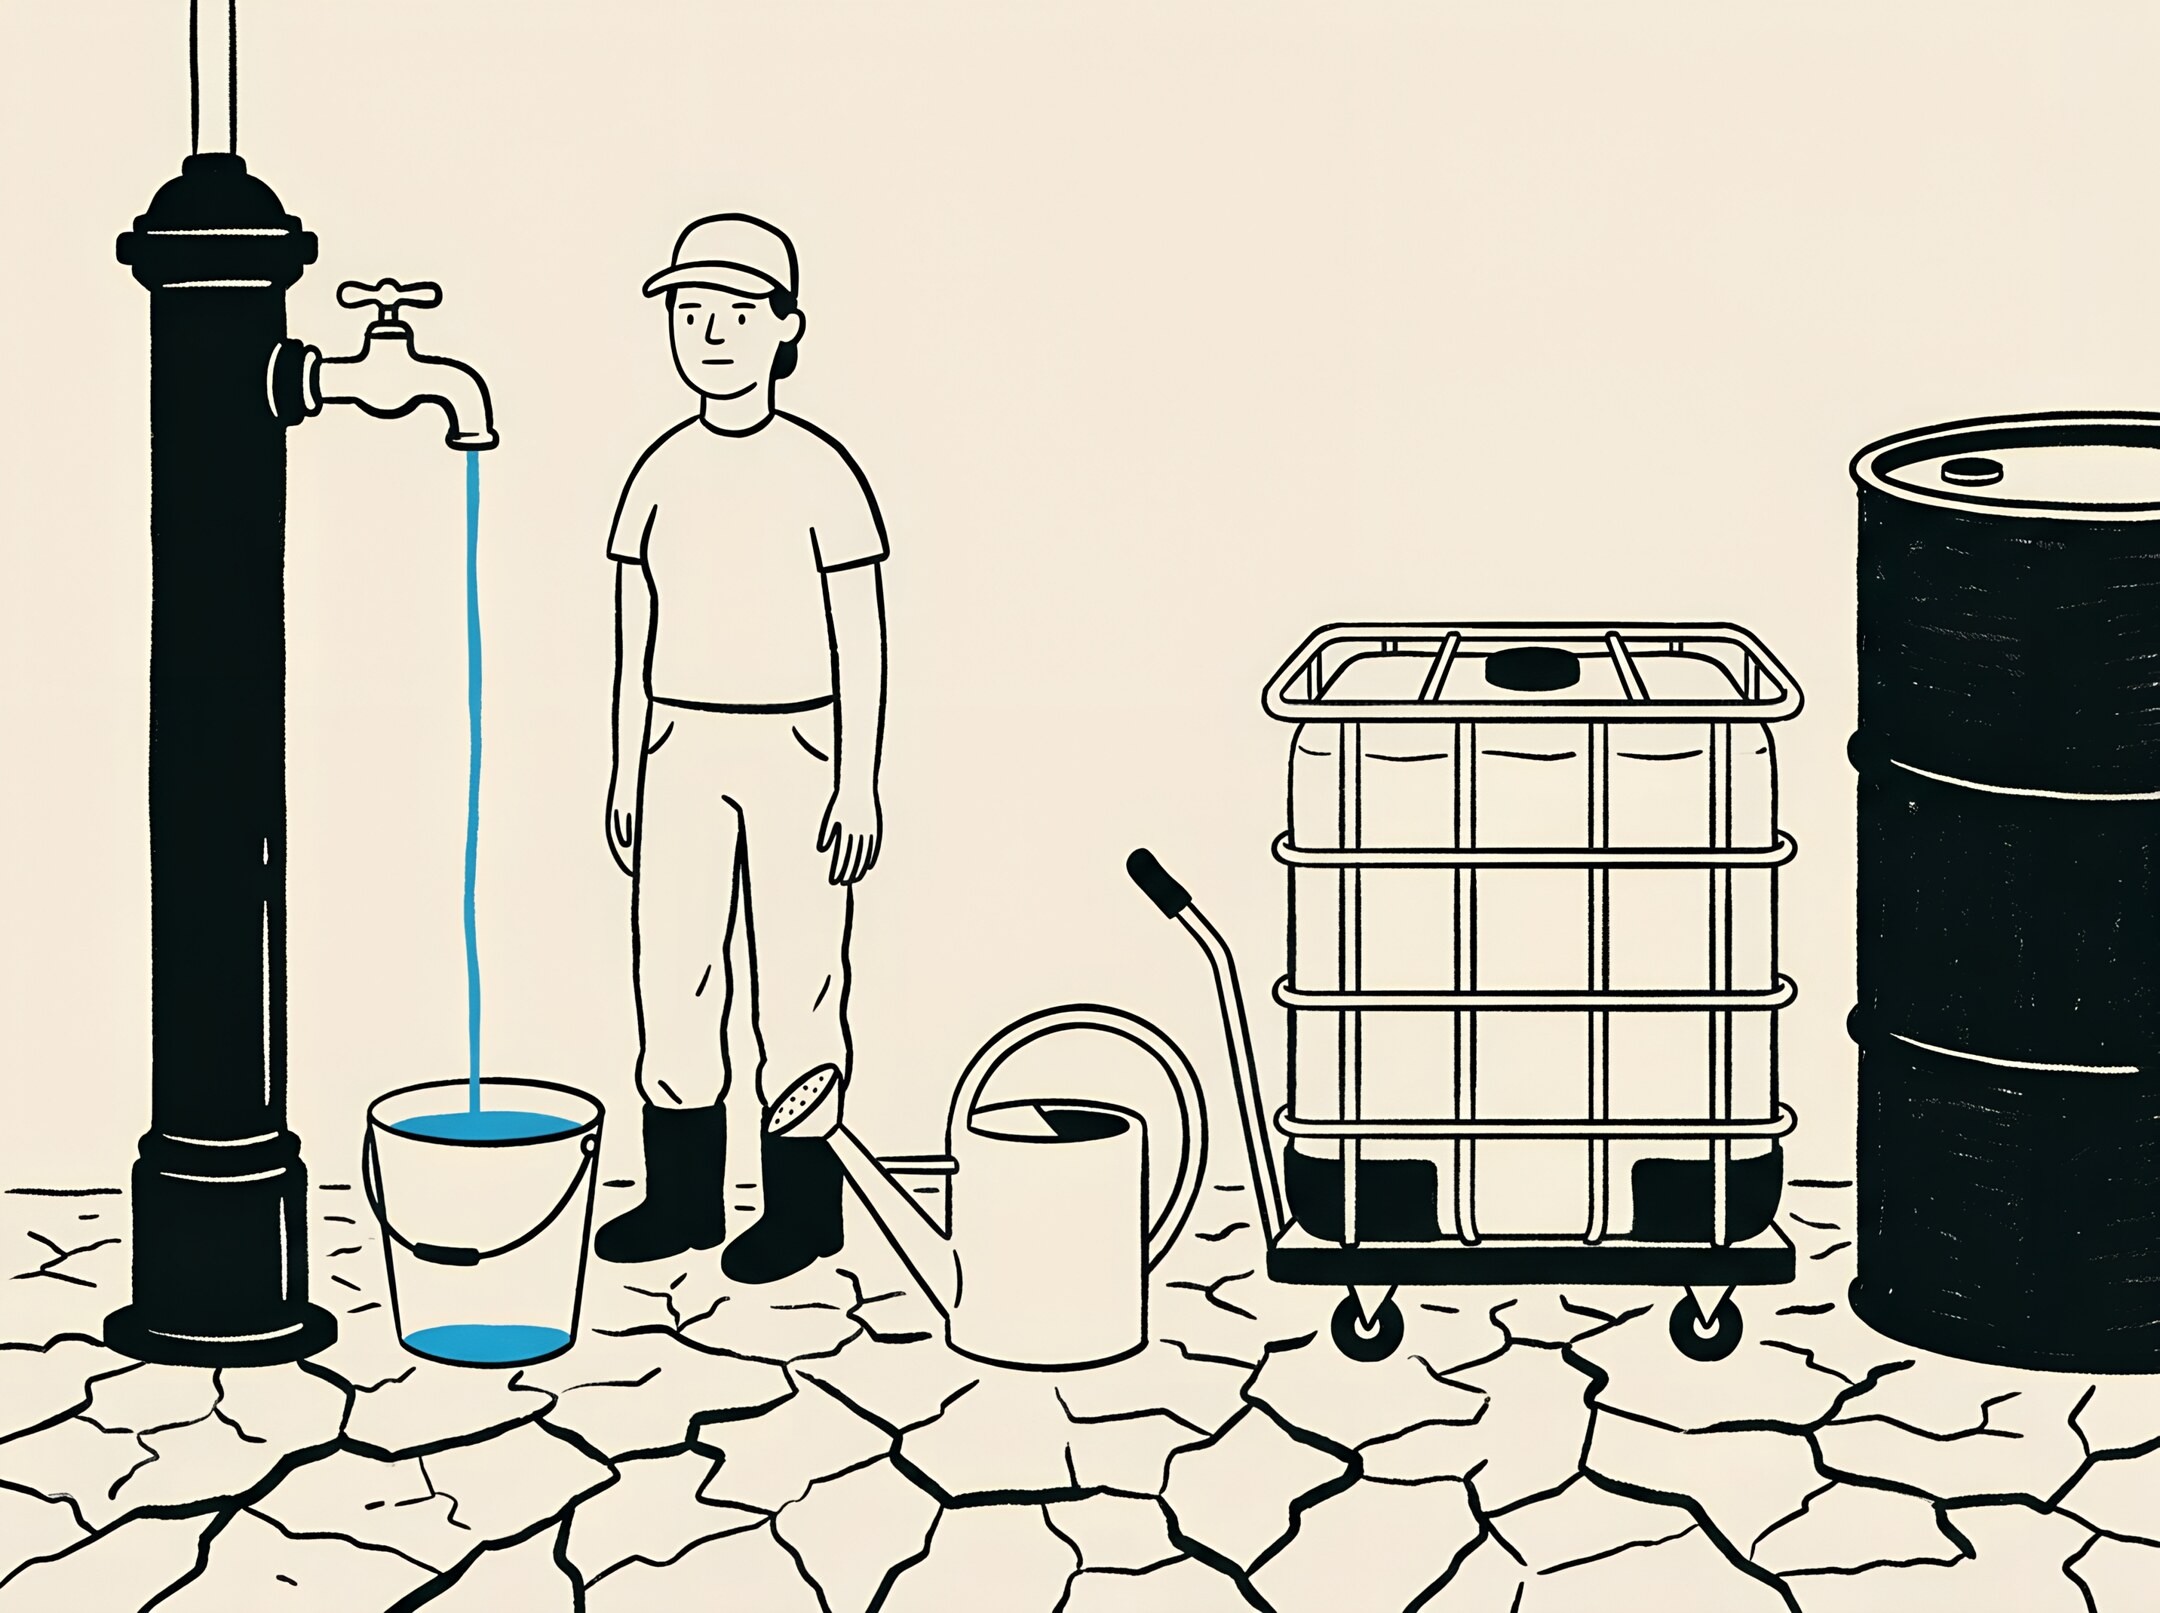
FAO has published draft principles on who may use water and on what terms, a quiet piece of international work that speaks directly to this year's fights over drought, wells and free irrigation.

A new report projects data centres' water footprint reaching 9.32 trillion litres by 2030, but the number is only meaningful once you know what it counts, and who is making the case.

An English coalition has costed what it would take to keep every drop of wastewater out of England's largest lake, £3.6–3.7 billion, and its modelling says nothing less ends harmful algal blooms.